Horsetooth Half Marathon course analysis
The next race on my calendar is the Horsetooth Half Marathon in Fort Collins. The elevation profile on the course’s website made it clear that I’ll be climbing some hills. The first step in developing my race plan was to analyze the race’s climbs so I could come up with a pacing strategy. I employed some common Python data analysis and visualization tools as well as a couple running-specific packages I built myself.
Data
To answer my questions, I grabbed a GPX file for the course from Strava.
I have found Strava’s elevation dataset is pretty accurate when I have compared it to the highest-quality elevation data I could get my hands on, so I think it is good enough for this coarse analysis. I will want to actually compare the elevation data on this course later, to validate my initial assumption.
My first step was to convert the GPX file to a format that could be easily read into the Python data analysis package pandas. To do that, I used a couple of packages I developed myself: heartandsole with activereader. I read the data streams from the GPX file into a pandas DataFrame, and then saved it as a CSV file for easy future use.
Analysis tool
I read in the data and crunched the numbers with pandas, then displayed the results and figures in a dashboard built with Plotly Dash.
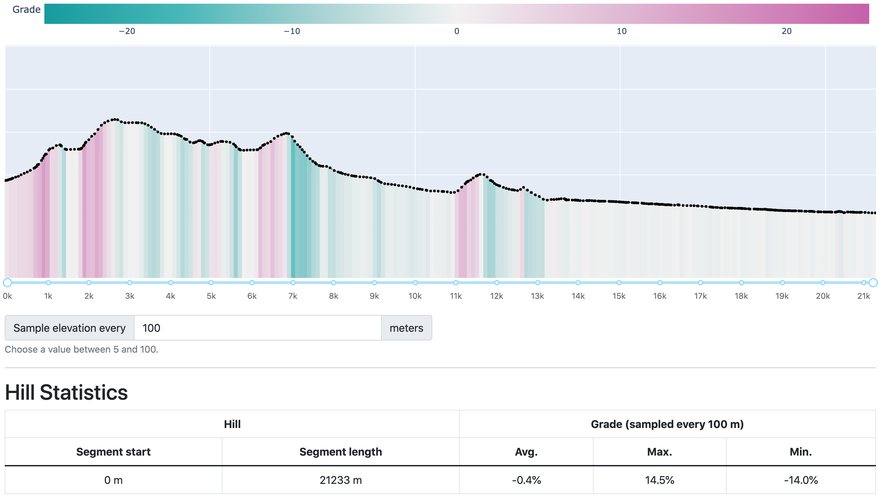
A screenshot of the elevation profile analysis dashboard
To use the dashboard to analyze a hill climb, I first identified the climb by adjusting the range slider to its beginning and end. Then, I chose a horizontal distance at which to evenly sample the elevation data. The elevation profile would then highlight the selected hill, showing the grade between each evenly-sampled point, and a table containing statistics would be generated.
Parameter choices
Hill start/end points
I just eyeballed this. I scanned across the elevation profile and identified the major ascents and descents. When there was a hill with a break in the middle, I got stats for the entire hill as well as for the sub-climbs.
Sample length
How much should the evenly-spaced elevation samples be spaced out? The answer would affect the calculated grade. Ideally, I'd pick something short enough to detect locally steep sections of the route, but also long enough to smooth out the effects of errors in the elevation data.
My choice was specific to the data I was working with; there are no hard and fast rules that apply to every elevation profile. The raw data points were rather spaced out - often with more than 50 meters between points. That’s because someone manually created this route by clicking points on a map using Strava. If the data had come from an activity file recorded with a device like a GPS watch, the data points would have been more tightly spaced due to their being recorded every second. A histogram of the file’s distance between data points helped me visually identify the typical spacing.
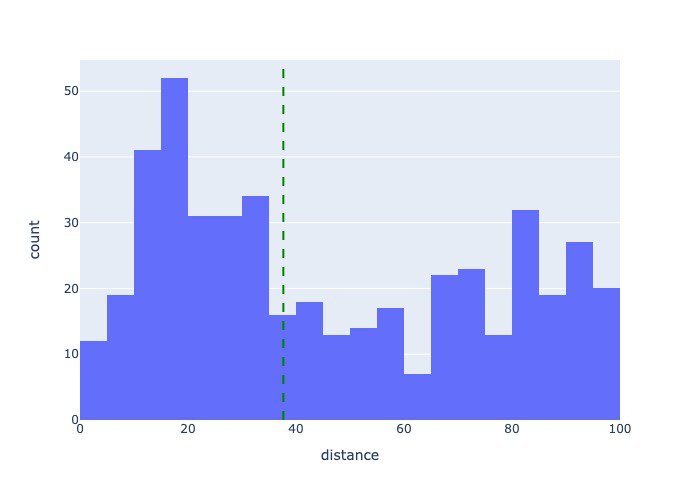
Histogram of point-to-point distances (median = 38 m)
I chose to re-sample the elevation profile at even 50-meter intervals. It doesn’t make much sense to resample the data at a shorter interval than it was recorded - the resampled data points would just look like a linear interpolation. And since I know the race takes place on roads, I can safely say that the course terrain won’t change suddenly. 50 meters felt like a reasonable amount of distance to calculate hill statistics over. Not too long that I would miss short, steep hills; not too short that I would introduce unrealistically large point-to-point grades because of errors in the elevation data.
Results
Climb number 1
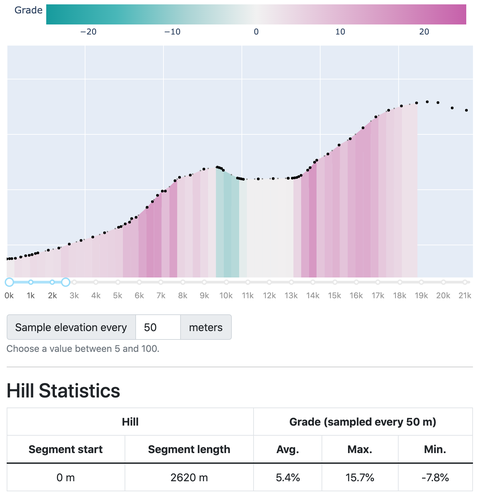
The first one begins on the starting line and lasts for a mile and a half. It is the biggest climb of the course, no matter how you look at it. Over 3 times as long and as high as the next biggest hill. Although its average grade is comparable to the course’s other climbs, that’s a bit of a misrepresentation. The big boy is actually made up of two steeper sub-climbs with a bit of elevation loss in between them, and each sub-hill is steeper, taller, and longer than any other on the course. And this first hill wins out in terms of short-term steepness too, with a 50-meter road segment gaining 8 meters of elevation, making a 16% grade.
So it’ll be a doozy, and something to plan for. I’m pondering whether it’s a blessing or a curse to encounter this big hill right out of the gate. On the one hand, it’ll be over with early and it won’t be lurking in the background waiting to deliver a knockout blow late in the race; but on the other hand, it will be very easy to go out too hard, leading either to an early setback (trying to regain composure while still running uphill) or to a late setback (blowing up late in the race). I think there is a case to be made for slowing to a walk, especially for slower runners. This course is made for negative-splitting (running the second half of a race faster than the first), so why not embrace the concept wholeheartedly and save the best for last?
Climbs number 2 and 3
The second and third climbs are similar to one another. Less than half a mile, average grade a little over 5%, and steepest section around 8%. That’s absolutely noticeable, but completely manageable.
Descents
The downhills deserve attention too! In general, they are less steep than the hill climbs, which is a good thing because it’s easier to take advantage of the gravity assistance on a shallower hill - you don’t lose as much energy hitting the brakes to stay in control. And there is simply more downhill than uphill in the race thanks to its net-downhill course.
The first appreciable descent is a rolling, 2-mile hill. It contains some uphill, but not much. The average grade would be barely perceptible, but the actual hill varies from 10% downhill to 4% uphill.
The second descent is a steeper 2.5-mile hill. It starts off pretty aggressively, averaging over 10% for about a half mile with a peak of almost 15%. That’s beyond noticeable...that’s the most serious downhill of the race. For me, how hard I attack it will be limited only by my anticipation of quad damage that could slow me down at the later stages. Otherwise, it’s bombs away. I will benefit from doing some hard downhill trail running as training.
After the last hill climb, I’ll drop down a less-steep-but-still-a-bomber hill, and then I’ll be on a steady half-percent downgrade for the remainder of the course. That’s really imperceptible, but it will allow me to feel better and go just a little faster - perhaps as little as 5 seconds per mile. But because the slope lasts forever, it has the potential to shave 30 seconds off my finishing time compared to a truly flat finish.
For any shorter descents, a pace goal isn’t really appropriate. I’ll just focus on staying relaxed and keeping my foot off the brakes. It’s really, really difficult to run too fast for your aerobic system to keep up on an appreciable downhill - the limitations shift to muscular strength, avoiding muscular damage for later in the race, and personal safety.
Next steps
Now that I know some basic statistics about each hill on the course, I need to figure out how exactly to approach them. There are a variety of tools to give me an idea of how an uphill or downhill pace translates to flat-ground pace, like Strava’s Grade Adjusted Pace and TrainingPeaks’ Normalized Graded Pace (and I have also been working on my own algorithm based on studies of runners on inclined treadmills). We’ll see how much I’ll need to slow down on the uphills to keep from blowing my lid, as well as how much I can speed up on the downhills to make up for lost time.
Summary
Building a dashboard allowed me to visually inspect the elevation profile data for my upcoming half marathon and to classify hill climbs and descents based on their nastiness. These insights will allow me to do two things:
- train specifically for the race by finding similar terrain near me
- develop a pacing plan for the race that adjusts for hills, rather than forcing me to work too hard to run each mile at the same pace
You can play around with my dashboard at https://aaronsch.pythonanywhere.com. The source code is located at https://github.com/aaron-schroeder/horsetooth-elevation.
Thanks to Elsa Scola for her blog post about deploying a Dash app on pythonanywhere.