In search of more perfect elevation data
If I had to summarize a hikes difficulty with a single metric, it would be elevation gain. Not mileage. On the trail, when desperate hikers drop to their knees and ask me HOW MUCH FURTHER, I tell them their progress on in terms of effort, but I am secretly using elevation as a proxy for effort. While perusing the existing hike-finding resources on the internet, one thing became clear: no one can agree on the elevation gain of a given hike. Is it 1282 feet to the top of Mount Sanitas? Or 1253? Or 1323? Or 1343? Depends who you ask, or rather which website you visit. (Spoiler: my methods have it at 1350 feet, using the standard route.) So I racked my brain...how are these numbers calculated? What is the source data? Why is agreement so poor?
Why are the numbers so variable?
I sure wanted to know. So I put my incessantly-questioning brain on the case. I knew this much: calculating a route's elevation gain is more than just subtracting the trailhead elevation from the summit elevation. That approach gets you the net elevation gain. The one-way elevation gain depends on the path you take to get there - the trail can rise and fall as you go. Calculating the total path-dependent elevation gain is a tricky thing: you need to sample the elevation at enough points along the way so that you get a true elevation profile. Even if you had a perfect elevation dataset, one that perfectly represented the contours of the Earth, you would still get the wrong answer if you didn't sample enough points on the route.
Routes with a lot of up-and-down require more climbing than the net elevation gain implies.
And that's just uncertainty due to methodological differences. What if I told you that there are a healthy number of elevation datasets to choose from, and they all have their own quirks? You might start to feel overwhelmed, like you would never find out how high anything really was. But don't worry: I did my research, and I'm sharing the results.
Making an informed decision about my elevation model
In the process of building this website and its functionality, I tried (and rejected) a few elevation models before sticking with the approach I have right now. First I used the elevation gain reported in my phone's fitness app, then I progressed through a series of digital elevation models (DEMs). First, predictably, was Google Maps, then The National Map's 1/3 arc-second DEM, and finally The National Map's 1-meter DEM. Basically, I used each service until it proved itself unreliable or deficient, and then I went searching for a service that better suited my needs. I will describe each step in turn.
Wahoo Fitness App
I am not here to throw shade on this app. It is the thing that got the ball rolling, the match that started the fire. I use the Wahoo Fitness app along with a heart rate monitor to get detailed data on my training hikes. From the app, I can export a file with data at one-second intervals. Latitude and longitude coordinates, heart rate, speed, cadence, vertical oscillation of my stride...it goes on. But the elevation data in the apps exported file was, to put it mildly, wack. For example, I did a roundtrip to Boulder's Bear Peak from the South Mesa Trailhead. The net elevation gain, from 5620' to 8450', is over 2800'. But the app reported my effort to be a leisurely 1210'. I dont know how the app gets its elevation data, but I knew that was wrong. Knowing I could not rely on the app's own elevation functionality was the beginning of my elevation quest.
Bear Peak's elevation profile according to Wahoo Fitness
Google Maps Elevation Service
I sometimes take it for granted that Google has the best data. Doesn't matter what it is, they probably have the most megabytes of it. And Google Maps is the first and only place for me to go when I am lost. Wouldn't it make sense for them to have the best elevation data? Well, prepare for battle, because we are now going to take down Google.
On the programming backend, working with Google's products is a joy. If you want to do something, they probably have a how-to. They support the crap out of their products. They are great. Except when they put a mountain summit in the wrong place. I had switched over to using Google Maps Elevation Service, a way to access their digital elevation model, and I was happily humming along. I had generated elevation profiles for Boulder's hikes that seemed reasonable. Then I used the Elevation API to make an elevation profile of a high-alpine hike in southwest Colorado. For some reason, as I approached the summit, Google's elevation data said I was descending. To this day, I don't know why everything was so jacked up, but you can see what I mean in a birds-eye view of Google Earth:
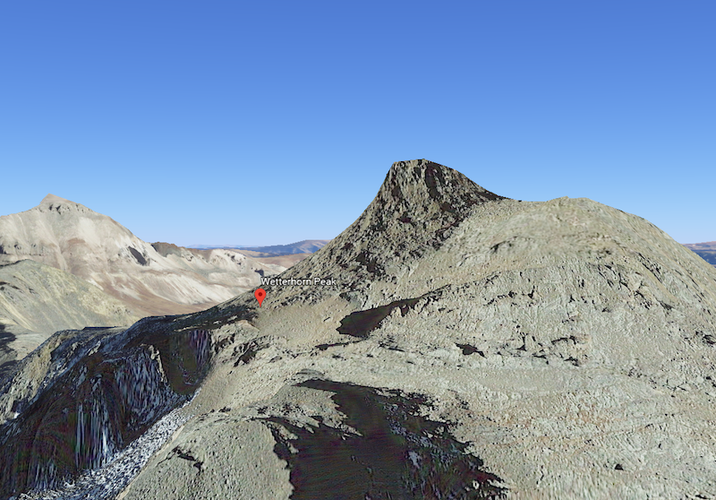
3D Google Earth rendering of Wetterhorn Peak
The red marker indicates the location of the real summit. But it isn't hard to see that their elevation model is not on the nose. In terms of vertical accuracy, the summit isn't that far off from reality. But it is in the wrong place.Why could this be? I have given up on finding that answer. To start off, Google is cryptic about where the elevation data even comes from. My best guess is that most of the data was generated from the Space Shuttle in 2000, using a technique known as interferometric synthetic-aperture radar (InSAR). It is also known that this technique left empty spots in the data, where the elevation was not defined. Mountainous regions were, of course, the most likely to fall victim to this data spottiness. In a general sense, I have no idea where Google gets its elevation data, but it is not good enough to serve you. And that is where I left it!
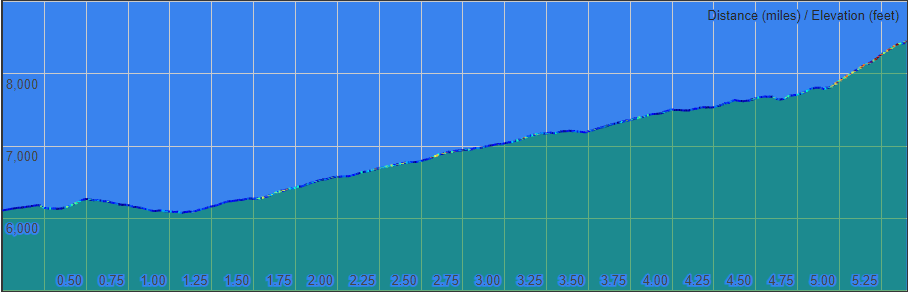
Bear Peak's elevation profile according to Google Maps. Note the small drop-off right at the summit (right side of profile), once again due to it being misplaced.
The National Map 1/3 arc-second elevation model
The National Map is a US government-run project with a mission to provide access to base geospatial information to describe the landscape of the United States and its territories...and it works really well. I only scratched the surface in my quest for data, as there is a lot more to explore than just elevation values. But Ill only talk about what I know.
The 1/3 arc-second model refers to the horizontal resolution of the data. 1/3 arc-second corresponds to a horizontal resolution of about 34 feet. In other words, this digital elevation model has data points about every 34 feet in each direction...over the entire United States. Please zone out for the next two sentences if you are feeling bored already. Speaking about latitude, not longitude: An arc-second is 1/3600 of a degree, which describes 1/360 of the Earth's circumference. All that to say: 1/3 arc-second of latitude is the Earth's circumference divided by 3600 x 360 x 3, or about 34 feet.
Unlike Google, the United States government was forced to disclose the source of their rich elevation dataset. Like Google, however, the government had a hard time distilling those sources into a short blurb. Suffice it to say, the two datasets have similar sources, mainly the Space Shuttle mission I mentioned above.
Whatever the sourcing, The National Map's elevation model was much more reliable than Google's in the high-alpine regions where I compared the two. The summit of Wetterhorn Peak was located in the right place, and the elevation value was pretty close to the actual surveyed elevation.
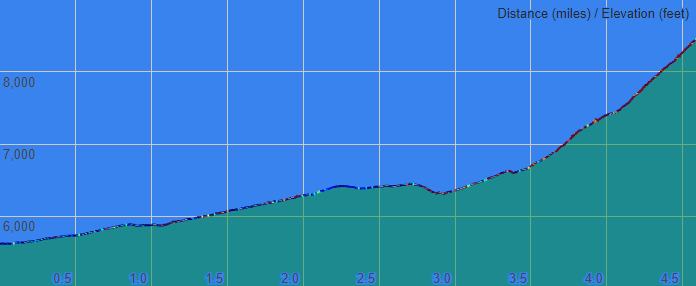
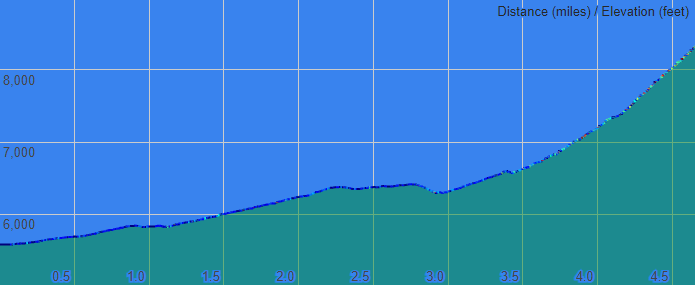
The color of the line is really red, meaning extreme slopes are present in the elevation data.
I did not have much time to celebrate this superior dataset; I quickly discovered it has some quirks around Boulder. Even with ~34-foot resolution, the elevation profiles produced using this model just didn't look right. It appeared that the method to interpolate between those 34-foot elevation values was a little wonky. The elevation profile made it look like I was hiking on flat ground punctuated by near-vertical climbs. Once again, a really great dataset was underperforming for my purposes. I didn't know what else to do. I almost gave up. Until...
The National Map 1-meter elevation model
Generated by the same programs as the 1/3 arc-second model. Except now, instead of 34-foot grid spacing, we are talking 1-meter (3-ish-foot) grid spacing. That is very, very high resolution. If you need higher-resolution data, why don't you just go out and survey it yourself, jerk?
Unlike the lower-resolution dataset I had just given up on, the 1-meter dataset is only available in select regions of the country. Luckily, because of its interesting topography, a lot of Colorado is documented. That includes Boulder.
The method of getting this data is similar to the Space Shuttle missionsjust replace the space shuttle with a heavily-instrumented airplane. Its a technique known as Lidar, and its the only source youll find in the 1-meter elevation model. Compared to training astronauts and launching a spaceship, its easier to get a bit of data this way, but it is also cumbersome to cover the entire US like this. Thats why weve only got little patches of coverage around this state, even:
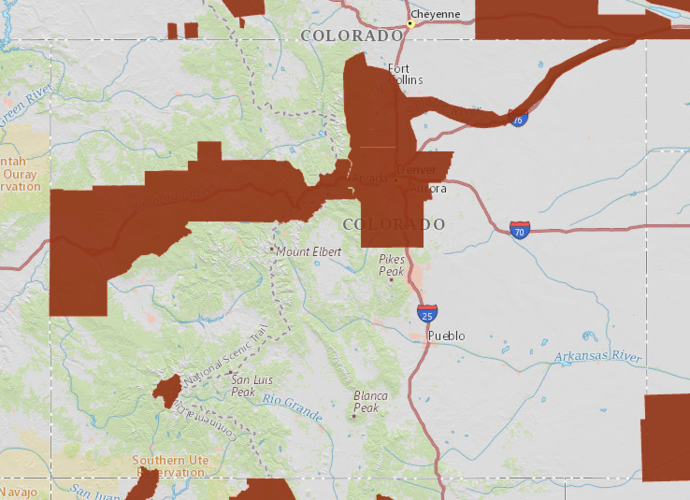
Map of Colorado's lidar coverage
I was happy to discover that Boulder is in the brownish splotch of coverage. All I had to do was download the data, and put it on my server, and figure out how to work with it, and figure out how not to overwhelm my server by looking at it, and boom! High quality elevation data for this beautiful city I call home. That is elevation data you and I can trust.
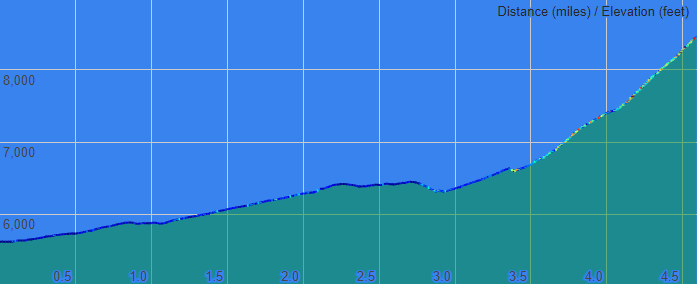
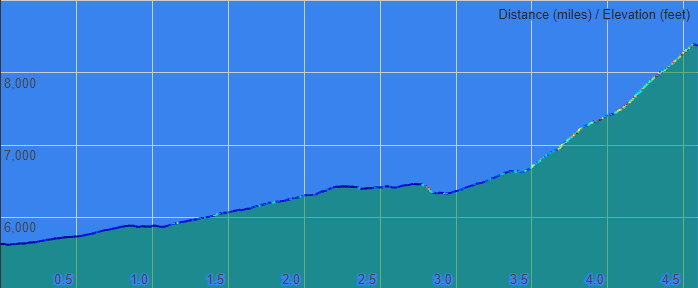
This profile looks like the other profiles, but that is deceiving. The underlying data does not suffer the same quirks.